
You've all seen those kids colouring books that have pictures that appear after you connect all the numbered dots in sequence. The market is like that when you trying to decide on the best course of action. Generally it is the big picture that tells you what to do in the individual stock and generally stocks follow the market flow.
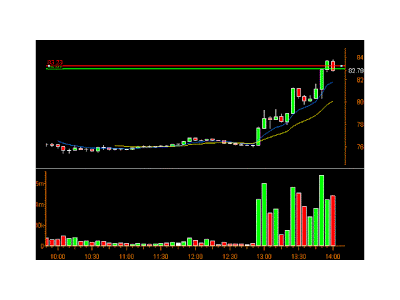
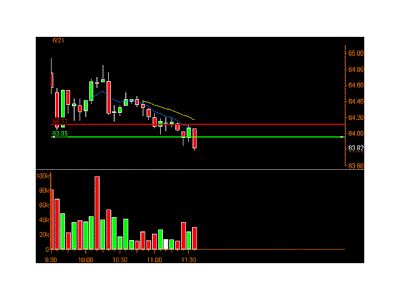
However in the case of V this afternoon it was trading on its own story and rising strongly in a falling market. I am long it. The 13:55 candle on V is green making new highs, the 13:55 candle on the QQQQ shown here has just taken a big step down red.
So I am ready for the probabilities to assert themselves and prepare to exit this long, take profit and get short.
It worked out perfectly both directions as the post below shows.
The impetus for me to cover my shorts this afternoon was when I saw what was happening on the QQQQ. This screen capture shows the Qs cease their downward trend and a green candle shows up. Well, that is all the signal I need to cover the shorts or sell the inverse longs and bank the profits.
Connect the dots of the big picture and the direction of the small picture you are in becomes much more clear.
And another thing, turn off CNBC as it is just a concentration breaker all day long. You need to be able to recognize and act on what the market is showing you and not be distracted by the constant bombardment of bullshit.


